
How to Look Up Harris County Jail Population Data
The official count lives on a county dashboard, not a news site. Harris County's Office of County Administration runs a data hub that links a live jail population tool. That tool is the safest source for current numbers. The Harris County data dashboards page gathers jail population, bail, the O'Donnell consent decree, court appointments, indigent defense, and traffic stop data in one place. The jail population figures sit at the top of that list. They are pulled from the county jail system and update on a regular cadence, so the number you see reflects a recent snapshot rather than a one-time report.
The live tool sits at the Harris County current jail population dashboard. It shows the current count, recent movement, and related breakdowns. Some figures are official tallies from the jail system. Others are derived or estimated, so read the labels on each chart before you quote a number. For a multi-year view, the dashboard also carries trend pages. The county treats this dashboard as the source of record, and outside reports often trace back to it. When a headline number and the dashboard disagree, the dashboard wins.
Harris County Jail Capacity Overview
The jail is not one building. Harris County runs a cluster of downtown facilities near San Jacinto and Baker streets, plus the Joint Processing Center where booking and release happen. The Sheriff's Office identifies five core downtown jail and JPC facilities. On top of those, the county outsources detainees to contract facilities in Texas, Louisiana, and Mississippi when the downtown count runs high. That out-of-county piece matters, because those people still count in the total system population even though they sit hundreds of miles away.
Exact rated capacity per building is the tricky part. The research for these pages did not find a current facility-by-facility design capacity table on the Sheriff's public pages. So the table below lists the downtown facilities by address and points the capacity column to the official sources. For verified bed counts and design capacity, the Texas Commission on Jail Standards publishes population reports, and the OCA dashboard carries the live count. Do not treat any single static number as the cap.
| Facility | Address | Rated Capacity |
|---|---|---|
| Joint Processing Center (JPC) | 700 N. San Jacinto, Houston, TX | See TCJS / OCA dashboard |
| 701 Jail | 701 N. San Jacinto, Houston, TX | See TCJS / OCA dashboard |
| 711 Jail | 711 N. San Jacinto, Houston, TX | See TCJS / OCA dashboard |
| 1200 Baker Jail | 1200 Baker, Houston, TX | See TCJS / OCA dashboard |
| 1307 Baker Jail | 1307 Baker, Houston, TX | See TCJS / OCA dashboard |
The Sheriff's Office posts facility-level information for visitors and families. The image below comes from the HCSO inmate visitation page, which lists the visitation schedule and the buildings where people are housed.
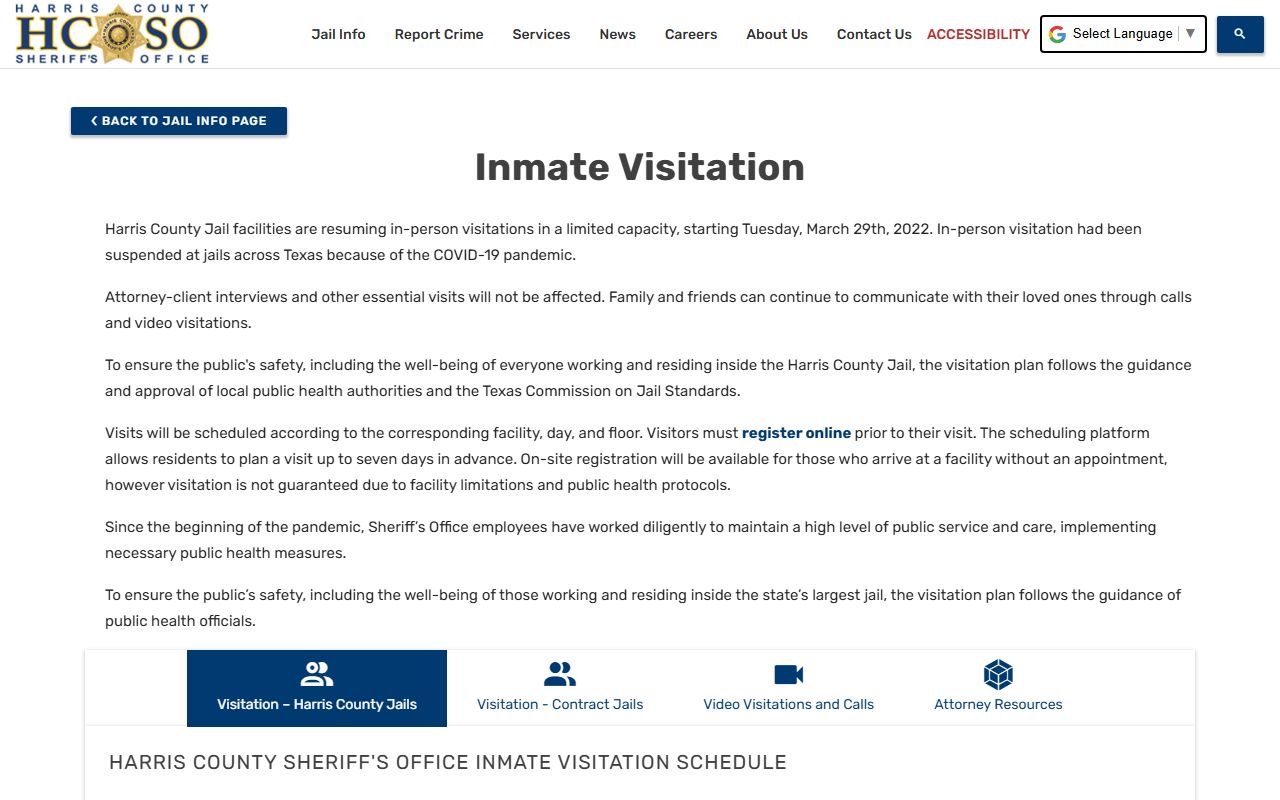
That page splits visits by floor and pod across the 1200 Baker, 701, and 711 buildings, which is a good clue to how the population is spread across the downtown campus.
Average Daily Population
Average daily population, or ADP, is the mean number of people held over a set period. It smooths out the day-to-day swings. Harris County's ADP runs high by any measure, since the jail is the largest in the state. The most reliable place to read ADP is the live dashboard, which tracks the current count and its recent movement. State reports from the Texas Commission on Jail Standards also list county ADP on a monthly basis.
Recent local reporting in 2025 and early 2026 described a population somewhere around 8,800 to 9,800, depending on the date. At times more than 1,400 detainees were housed out of county. Treat those as dated snapshots, not the current count. The figure moves with bookings, court settings, bond decisions, and case backlog. For any decision that turns on the exact number today, pull the live dashboard count on the day you need it.
Demographic Breakdown
The dashboard and state reports break the population down in several ways. Demographic splits cover gender, race, and age. They also cover legal status and charge level, which we handle in their own sections below. Because the exact percentages shift with each refresh, the breakdown here points to where each figure lives rather than freezing a snapshot that goes stale fast. The county is the source for local demographic detail. National benchmarks come from federal data.
The table below maps each demographic category to its best source. Read the live figures from the linked tools, since the share in each group changes as people are booked and released.
| Category | Where to Read It |
|---|---|
| Gender split | OCA live jail population dashboard |
| Race and ethnicity | OCA dashboard and BJS jail reports |
| Age distribution | OCA dashboard and TCJS reports |
| Legal status (pretrial or sentenced) | OCA dashboard, see the section below |
| Charge level (misdemeanor or felony) | OCA dashboard and county case data |
One note on honesty: the local demographic figures are county-specific and pulled from county systems, while the broad rate comparisons are state and national. Keep the two straight when you cite them.
Pretrial vs. Sentenced Population
This split drives much of the local debate. A pretrial detainee has been charged but not convicted, and is held while the case moves. A sentenced inmate has been convicted and is serving time. Local reporting has repeatedly noted that most people in the Harris County jail are pretrial. That is a key fact about the system. It means a large share of the population is legally innocent and waiting, not serving a sentence.
The exact percentage moves with court speed, bond practice, and case backlog, so the dashboard is the place to read the current share. County bail reform work, including the O'Donnell consent decree on misdemeanor bail, ties directly to this number. The split below shows the structure of the two groups. For the live percentage, use the dashboard.
| Status | What It Means | Current Share |
|---|---|---|
| Pretrial | Charged, not convicted, held while the case is pending | Majority; see OCA dashboard |
| Sentenced | Convicted and serving a jail term | Minority; see OCA dashboard |
Note: the pretrial share is the single most-cited number in local jail debates, so always quote the dashboard figure with the date you read it.
Misdemeanor vs. Felony Population
Charge level is another way to slice the count. Felony cases run through the district courts and the District Clerk. Misdemeanor cases run through the county criminal courts at law and the County Clerk. The jail holds people from both tracks, but the mix leans toward felony charges, since misdemeanor defendants are more often released on bond or personal recognizance. Bail reform has pushed many low-level misdemeanor defendants out of pretrial custody over recent years. For how a charge becomes a booking in the first place, see Harris County arrest records.
The dashboard and county case data carry the current charge-level breakdown. The image below is from the HCSO bonding process page, which explains how bond can move a charged person out of the jail population.
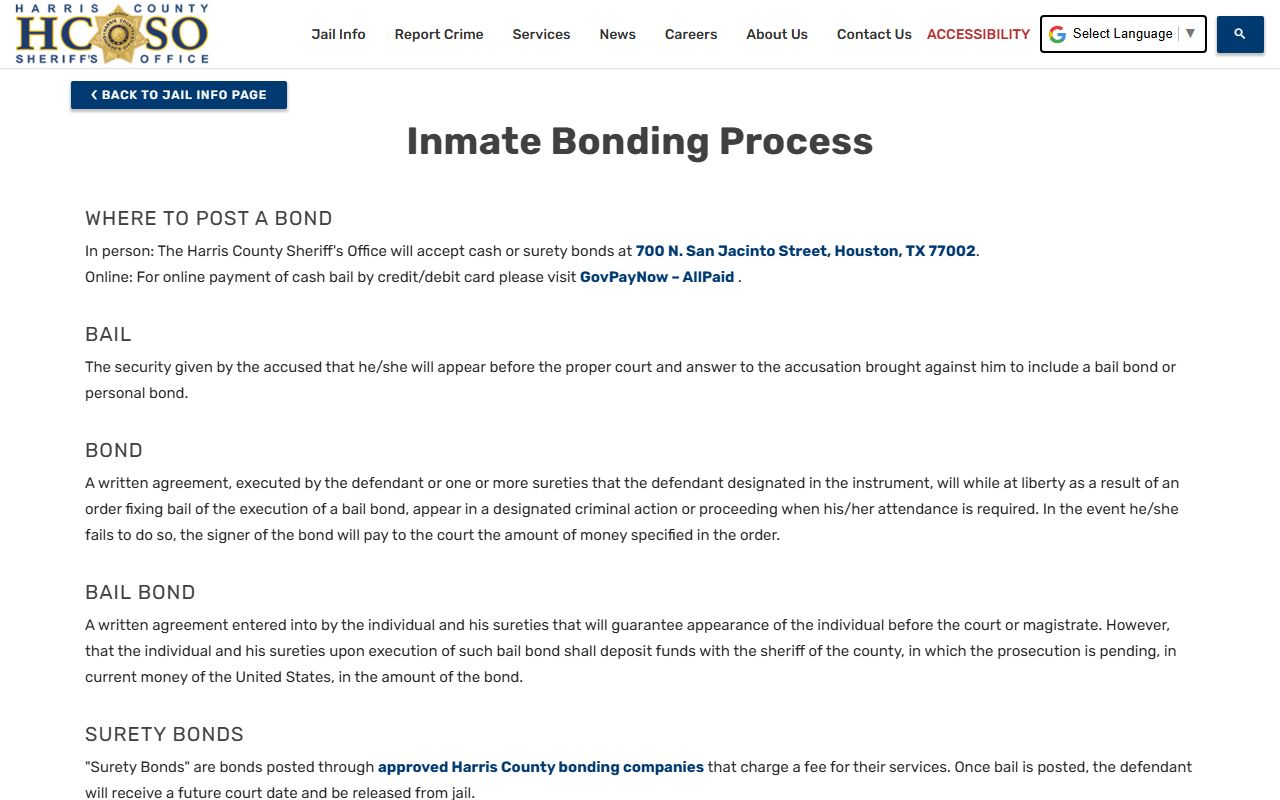
Bond decisions are a big lever on the count. When more people post bond or get personal bonds, the misdemeanor share of the jail tends to drop.
Mental Health and Medical Population
A large share of the jail population has medical or mental health needs. Every person booked is screened on entry at the Inmate Processing Center for medical and mental health issues before housing. That screening includes a nurse evaluation, communicable disease checks, and a review of prescription medication. The jail provides dental, optical, prescription, medical, and mental health care on site. County leaders have stressed the high mental-health need among detainees for years.
That need has shaped county policy. In 2025, Commissioners Court discussed a smaller mental-health-focused facility as a possible answer to crowding and staffing strain, rather than a large new jail. The county also runs specialty dockets such as a Felony Mental Health Court and competency restoration tracks, which show up in district court records. The image below comes from the HCSO inmate FAQ page, which describes the intake screening and on-site care.
The FAQ also notes that prescription drugs cannot be brought in, because the Sheriff's Office fills them through its own pharmacy. Care concerns can be raised through the county's Quality of Life portal.
National and State Context
A raw head count means more when you compare it to other places. The standard way to do that is a rate per 100,000 residents. Federal data from the Bureau of Justice Statistics tracks jail populations across the country in its annual jail inmate reports. The Vera Institute of Justice and the Prison Policy Initiative publish state and local incarceration trends built on that data. Those sources are the place to pull a national and a Texas rate to set the local count in context.
The block below is a context frame, not a live county figure. The exact per-100,000 rate for Harris County depends on the current jail count and the county's population, so read the live count from the dashboard and the benchmark rates from BJS and Vera. The point is the comparison, not a single fixed number.
| Level | Jail Rate per 100k | Source |
|---|---|---|
| Harris County (county-specific) | Derived from OCA dashboard count and county population | OCA dashboard |
| Texas (state context) | See state jail rate | BJS / Vera |
| National (U.S. context) | See national jail rate | BJS jail inmate reports |
Note: the county row is local data, while the state and national rows are outside benchmarks, so label them clearly any time you put the three side by side.
Population Trends Over Time
The Harris County jail count has moved a lot over the past five years, and the swings track real events. The pandemic in 2020 and 2021 disrupted court operations and changed bookings and case flow. By 2022, local reporting and dashboard discussion often cited crowding, a high pretrial share, and a sharp count of in-custody deaths. The system stayed under heavy scrutiny through 2023, including federal civil-rights attention and a push to cut the case backlog.
More recent years brought both progress and strain. Some measures improved while others did not. The dashboard carries the multi-year trend, and the points below are dated snapshots to verify against it, not current fact.
- 2020-2021: pandemic court disruption reshaped bookings and case flow.
- 2022: reporting cited crowding, a high pretrial population, and 27 in-custody deaths.
- 2023: ongoing scrutiny, federal civil-rights reports, and backlog-reduction work.
- 2024: jail deaths reportedly fell to 10, though staffing and standards issues stayed.
- 2025-2026: reporting put deaths at 20 for 2025 and the count near 9,800 on a dated dashboard snapshot.
In April 2025, county leaders approved $7.6 million for District Attorney initiatives aimed at cutting the jail population and the backlog, including expanded domestic violence and mental health diversion work. In January 2025, state involvement followed a Texas Commission on Jail Standards noncompliance notice. These items are dated context. For the current count and trend line, the live dashboard is the source.
Searching for Harris County Inmate Records by Name
Jail population data is aggregate data, not a tool for finding one person. To look up a single name in the live jail roster, use the Harris County inmate records page, which walks through the Sheriff's inmate search portal and the offense inquiry tool. To find someone after release, see the released inmates page instead.
Where the Data Comes From
Several sources feed the picture, and they serve different jobs. The county's own dashboard is the official live count. State reports add monthly capacity and ADP figures. Federal and nonprofit data supply the national context. Knowing which source answers which question keeps the numbers honest, since a county head count and a national rate are not the same kind of figure.
The Sheriff's Office also publishes the day-to-day jail information that families rely on, from mail rules to trust-fund deposits and phone access. The image below is from the HCSO inmate mail page, which lists the facility mail process and the out-of-county addresses tied to the outsourced population.
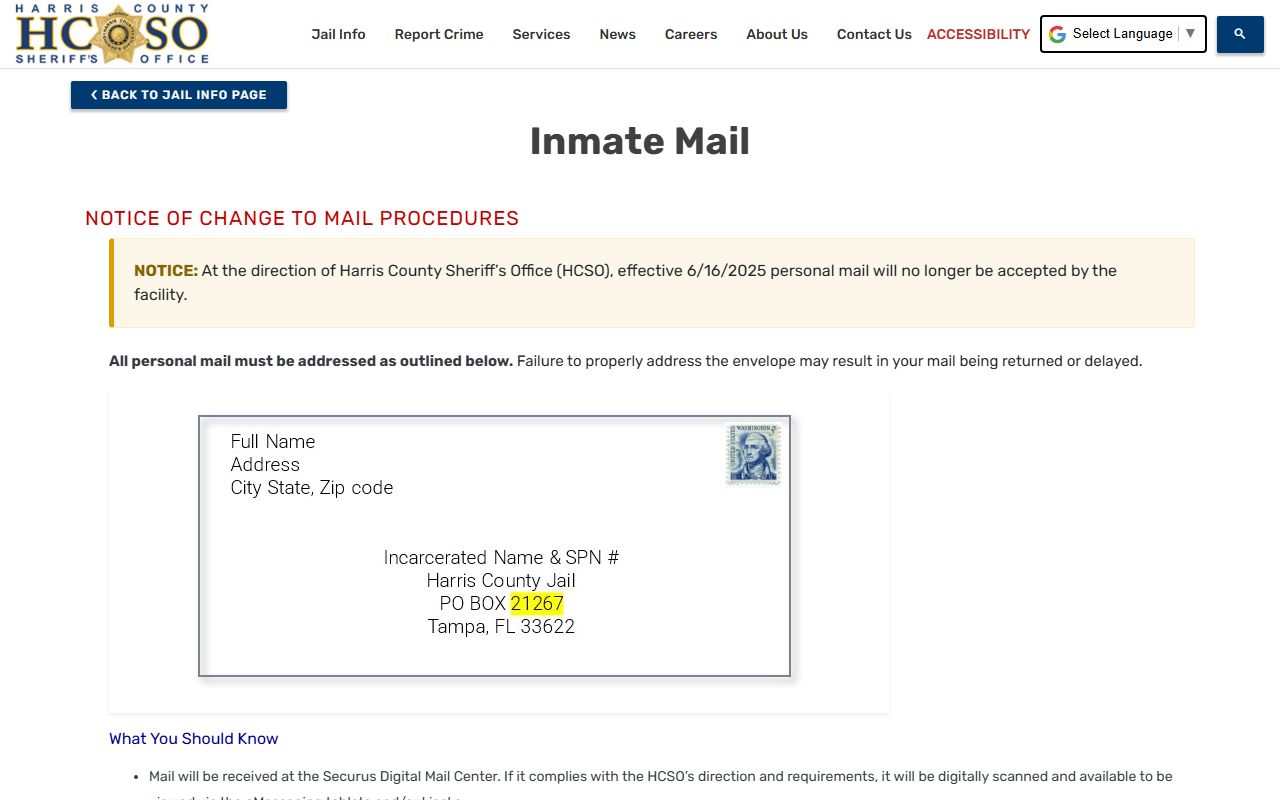
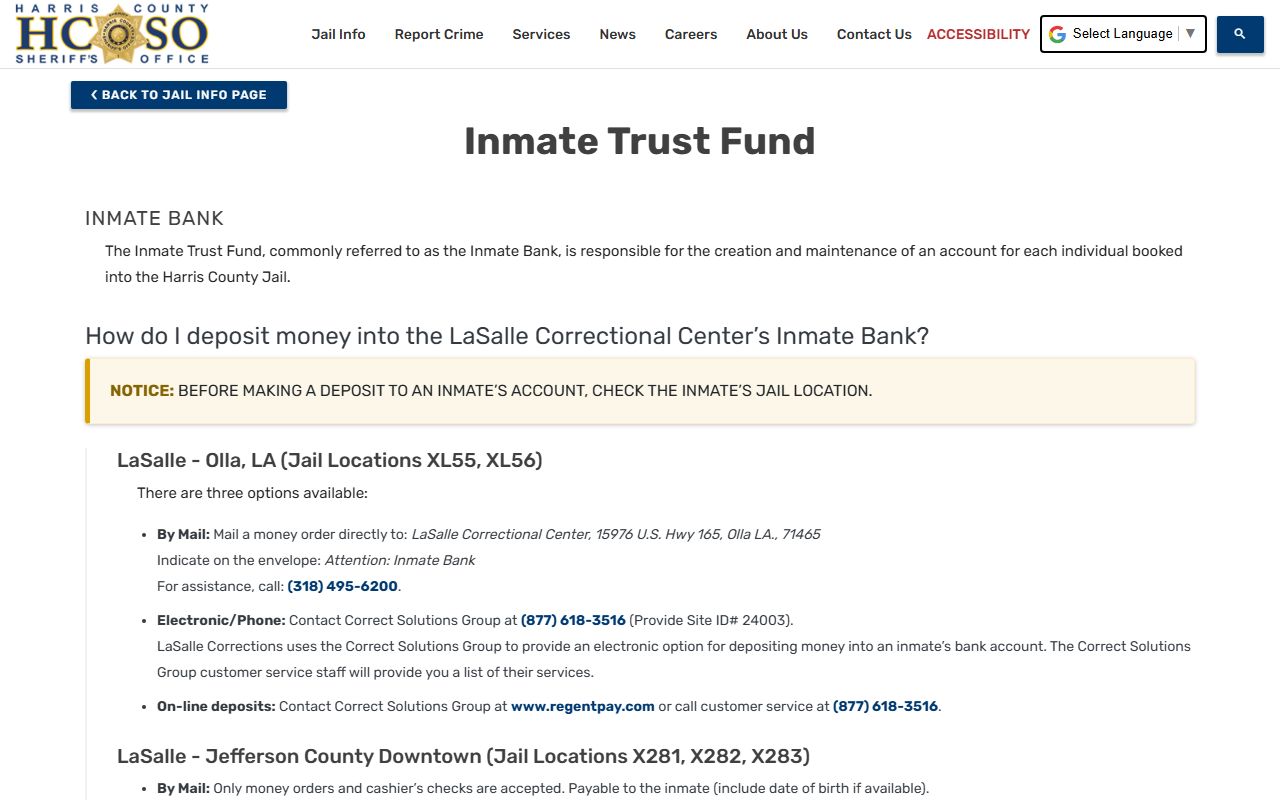
Money handling is tracked the same way. The image below comes from the HCSO inmate trust fund page, which explains the inmate bank account opened at booking.
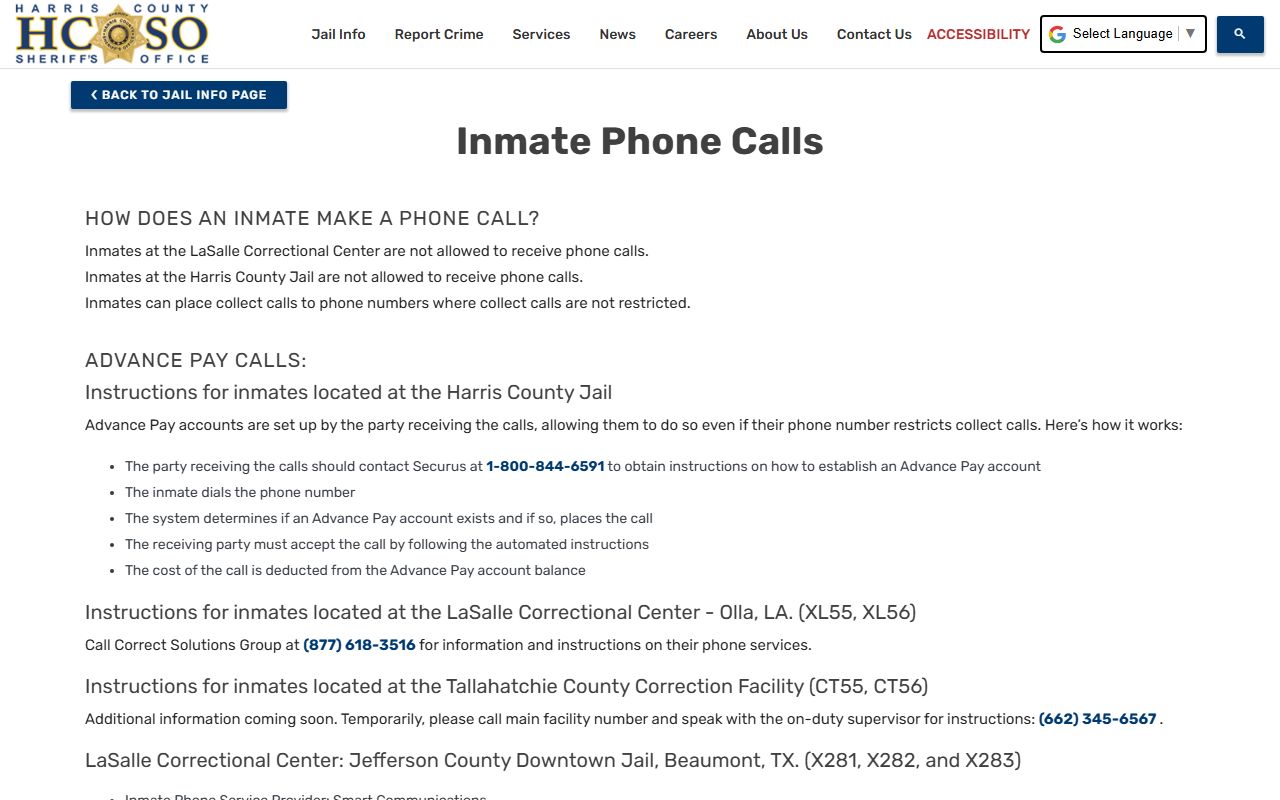
Phone access rounds out the contact picture. The image below is from the HCSO inmate phone calls page, which sets out how calls work for people in custody.
For the official population figures, rely on the OCA jail population dashboard and the Texas Commission on Jail Standards reports. For broad context, lean on BJS jail inmate reports and Vera incarceration trends. Together they let you state a local count, compare it to the state and the nation, and flag which number is which.